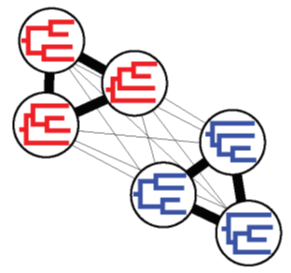
Using Community Detection to Group Trees
Once you have performed an NLDR and visualized your trees in treespace, you may want to do additional analyses to find natural grouping of trees in order to identify differences in topologies or branch lengths. While using standard grouping approaches on NLDR visualizations can be useful, the results may not always be totally accurate. This is due to the way in which NLDR projects trees into a given number of dimensions. Depending on the size and number of your trees, treespace can be extremely large and complex, and often times, accurately representing all of the information in a set of tree distances requires high dimensionality. In order to project treespace into a human-visualizable two or three dimensions, NLDRs may be forced to distort the data.
In order to avoid any distortion or artifacts of projection, we can use community detection directly on the underlying network of tree-to-tree distances to ensure that we are capturing all of the information in the data. Then, we can overlay these community detection results onto an NLDR plot to visualize how the grouping of trees are represented in the projection of treespace. This tutorial will walk you through the steps involved in this process. For details on performing an NLDR on a set of trees, visit the NLDR tutorial.
1. Calculating an Affinity Matrix
Using an already-calculated distance matrix, we will calculate an affinity matrix upon which community detection will be performed. The effect of this is that trees with smaller tree-to-tree distances (more similar trees) will have larger affinities, and vice versa. Currently in CloudForest, affinity matrices can be calculated using either reciprocal or exponential transformations. Feel free to experiment and compare results with both, although limited testing suggests that reciprocal transformations seem to produce more stable results.
To calculate an affinity matrix:
- Expand the CloudForest header in the tool panel on the left hand sign of the interface
- Select TreeScaper-Affinity
- Select the appropriate distance matrix
- Select a transformation method (Reciprocal or Exponential)
- Click Execute
2. Performing an Automatic Community Detection
A good first step in performing Community Detection is to let the algorithm automatically dictate which range of parameter values to explore.
To perform an automatically tuned community detection:
- In the CloudForest tool panel, select TreeScaper-CommunityDetection
- Select the appropriate affinity matrix
- Select a community detection model to use
- Select Automatic Tuning
- Click Execute
3. Visualizing results
Once the jobs in the history panel are green and community detection is complete, it’s time to visualize the results! This step will use a previously computed NLDR projection, so ensure that you have performed one.
- Select Visualize at the top of the screen, and select Create Visualization (this step may require you to be logged in to the platform. For beta purposes, use user/pass admin/admin)
- Scroll down and click on CloudForest Visualizations, and select Create Visualization
- Select Full Screen at the top of the page to open a new tab with a full screen visualization menu
- Under Visualization, select Community Detection. This should automatically display the most recently computed Community Detection and NLDR results
- Use the slider under the community detection results in order to scroll through lambda values. The NLDR plot will automatically update each tree’s color based on which community it belongs to for each given lambda value
In order to find groupings with some biological meaning, we will be looking for plateaus of lambda values that result in the same community structure. These can be identified in the red “Community Labels” line in the Community Detection plot, similar to the following:

4. Community Detection using Manual Tuning
In some cases, community detection using automatic tuning may not have plateaus that are as clear as in the above example. To address this, we can use Manual Tuning to view the results of a specific range of parameter values in better detail. This can be useful in a scenario, such as the one pictured below, when the Community Labels plot line is not as well defined.

To perform manual tuning:
- Navigate to the TreeScaper-CommunityDetection tool in the CloudForest tool panel
- Select the appropriate affinity matrix
- Select a community detection model to use
- Select Manual Tuning. For all affinity based networks, we will use Manual Tuning with Fixed λ-. This will open up a new category of parameter values, defined as follows:
- Lambda Negative: This parameter will not affect the analysis for affinity based networks, and therefore should not be changed
- lps: Starting lambda value in the range to be analyzed
- lpe: Ending lambda value in the range to be analyzed
- lambda_pos_iv: Size of steps to be taken between lambda values
Using the previous image as an example, if we wanted to analyze lambda values between 0 and 0.25, we would set lps to 0.0 and lpe to 0.25. You can control how fine you would like the search to be using lambda_pos_iv. For example, a fairly coarse would use a lambda_pos_iv value of 0.1, and a fairly fine search perhaps 0.01. As with everything, experiment with this for yourself!
You can now visualize the new manually tuned community detection results in the same way as defined for the automatic tuning!
Community detection can be a great way to find intrinsic structures of trees in treespace, and can be a great way to identify groups of differing, or perhaps competing, trees for further analysis. It can also be performed using Bipartition-Covariance networks to identify which bipartitions are causing major disagreements between trees, and the methods for this will be laid out in a future tutorial!
